2026年6月3日
名前
茅野壮甫
自分で作った図形(コードと画像)
✅ 練習問題 5-1-1
let rainfall = [13.0, 9.5, 86.0, 38.0, 137.0, 215.5, 163.0, 78.5, 119.5, 130.5, 25.0, 36.0];
let grid = 20;

function setup() {
  createCanvas(300, 300);
  background(255);

  drawGrid();     // グリッド線の描画
  drawAxes();     // 座標軸の描画
  drawBarGraph(); // 棒グラフの描画
}

function drawGrid() {
  stroke(200);
  strokeWeight(1);
  for (let x = 0; x <= width; x += grid) {
    line(x, 0, x, height);
  }
  for (let y = 0; y <= height; y += grid) {
    line(0, y, width, y);
  }
}

function drawAxes() {
  stroke(0);
  strokeWeight(1);
  line(grid, 0, grid, height - grid);
  line(grid, height - grid, width, height - grid);
}

function drawBarGraph() {
  stroke(0, 150, 200);
  strokeWeight(10);
  for (let n = 0; n < rainfall.length; n++) {
    let x1 = n * grid + (grid * 2);
    let y1 = height - grid;
    let x2 = x1;
    let y2 = y1 - rainfall[n];
    line(x1, y1, x2, y2);
  }
}
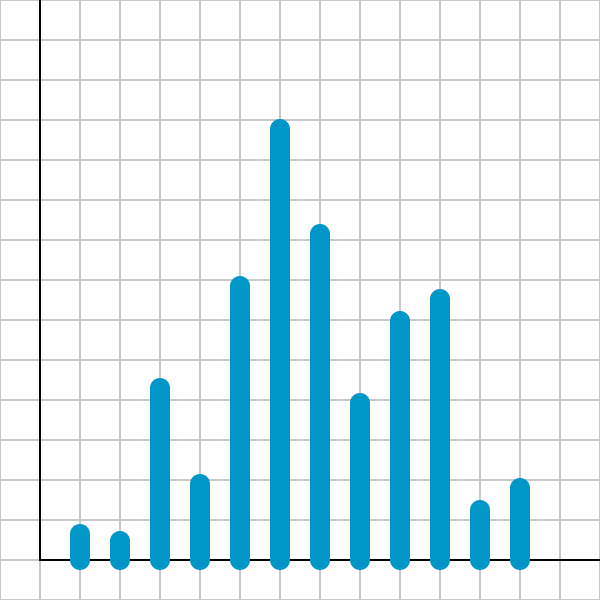
📷 実行結果
✅ 練習問題 5-1-2
let rainfall = [13.0, 9.5, 86.0, 38.0, 137.0, 215.5, 163.0, 78.5, 119.5, 130.5, 25.0, 36.0];
let grid;
function setup() {
  createCanvas(300, 300);
  background(255);
  grid = 20;
  drawGrid();
  drawAxes();
  // 棒グラフの描画
  stroke(0, 150, 200);
  strokeWeight(10);
  for (let n = 0; n < rainfall.length; n++) {
    let x1 = n * grid + (grid * 2);
    let y1 = height - grid;
    let x2 = x1;
    let y2 = y1 - rainfall[n];
    line(x1, y1, x2, y2);
  }
}
function drawGrid(){
  // グリッド線の描画
  stroke(200);
  strokeWeight(1);
  for (let x = 0; x <= width; x += grid) {
    line(x, 0, x, height);
  }
  for (let y = 0; y <= height; y += grid) {
    line(0, y, width, y);
  }
}
function drawAxes(){
  // 座標軸の描画
  stroke(0);
  strokeWeight(1);
  line(grid, 0, grid, height - grid);
  line(grid, height - grid, width, height - grid);
}
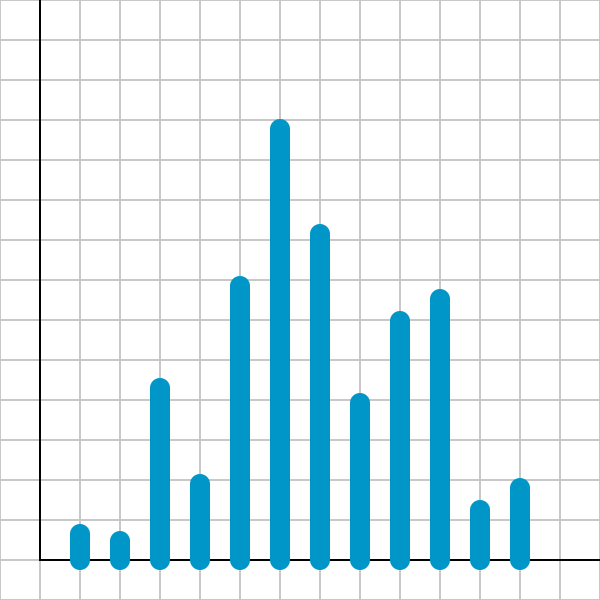
📷 実行結果
✅ 練習問題 5-1-3
let rainfall = [13.0, 9.5, 86.0, 38.0, 137.0, 215.5, 163.0, 78.5, 119.5, 130.5, 25.0, 36.0];
let grid;
function setup() {
  createCanvas(300, 300);
  background(255);
  grid = 20;
  drawGrid();
  drawAxes();
  drawBarGraph();
function drawBarGraph(){
  // 棒グラフの描画
  stroke(0, 150, 200);
  strokeWeight(10);
  for (let n = 0; n < rainfall.length; n++) {
    let x1 = n * grid + (grid * 2);
    let y1 = height - grid;
    let x2 = x1;
    let y2 = y1 - rainfall[n];
    line(x1, y1, x2, y2);
  }
  }
}
function drawGrid(){
  // グリッド線の描画
  stroke(200);
  strokeWeight(1);
  for (let x = 0; x <= width; x += grid) {
    line(x, 0, x, height);
  }
  for (let y = 0; y <= height; y += grid) {
    line(0, y, width, y);
  }
}
function drawAxes(){
  // 座標軸の描画
  stroke(0);
  strokeWeight(1);
  line(grid, 0, grid, height - grid);
  line(grid, height - grid, width, height - grid);
}
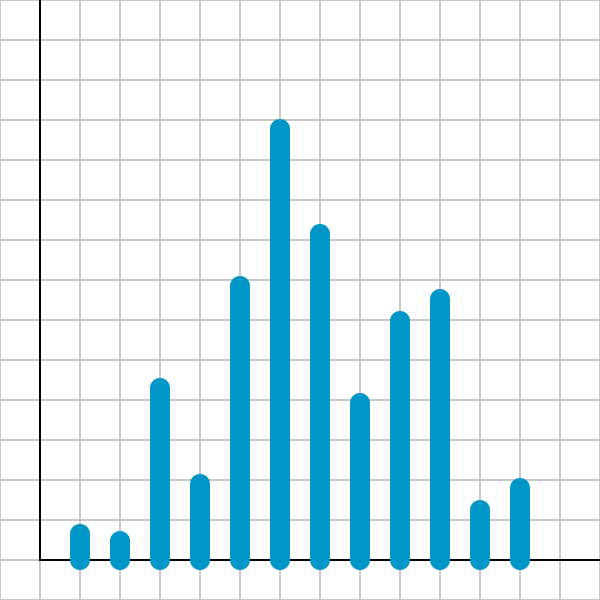
📷 実行結果
まとめ・感想
関数を使うことでコードがわからなくなったときに整理できてどの順番で何が行われているかをすぐ理解できる。